Thursday, February 13, 2025

Assess process monitoring output in Linux to identify the root cause of the issue - with Gen AI assistance


Requirement: Launch a process monitoring command and process the output using a shell script & use an AI tool to document the flow


tools: Shell script, gemini & mermaidchart.com


This is part of a multipart series in identifying a root cause on a typical chicken-egg story kind of issue :)


YouTube: 


Step 1) Command which monitors the process:


You can launch the below command on a abnormally loaded machine; so you can use this output to assess the RCA. As going after top command every minute is challenging.


while true

do

echo "zzz ***$(date '+%a %b %e %T %Z %Y')" >> /tmp/psinfo2.out

ps -aeo user,pid,ppid,pri,pcpu,pmem,vsize,rssize,wchan:42,s,start,cputime,command >> /tmp/psinfo2.out

sleep 30

done


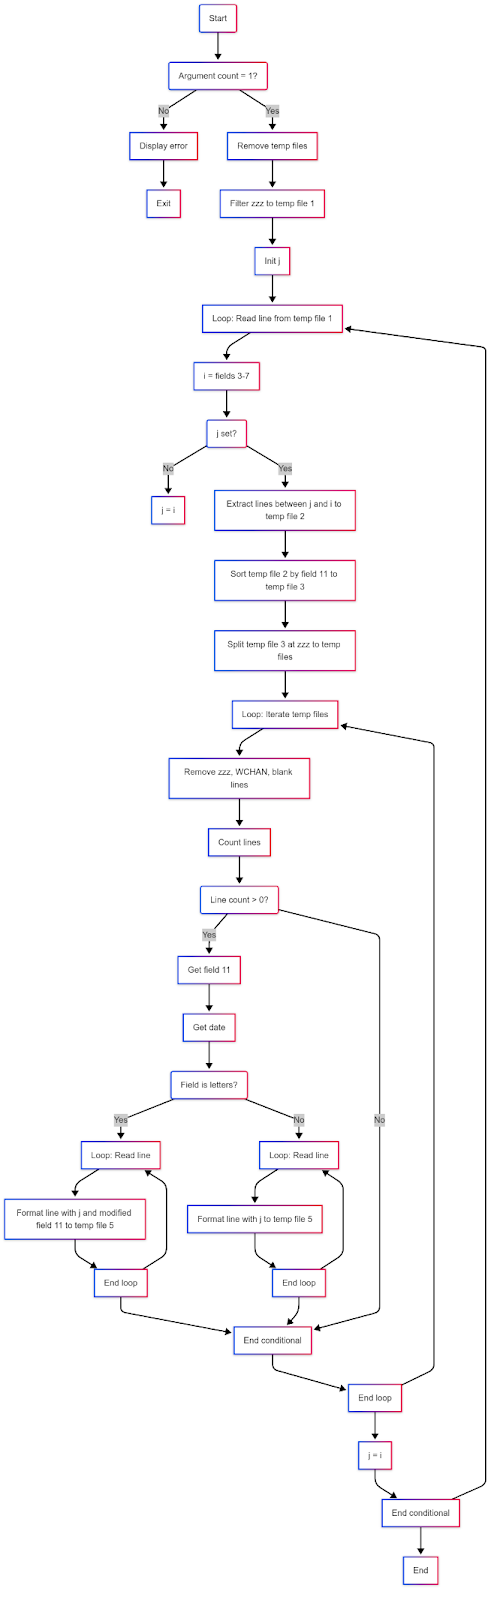
Step 2) Develop a script that is able to digest the above commands output and print it to a more readable info [preprocess]


#!/bin/ksh

if [ $# -ne 1 ]

then

echo "please provide valid osstats file"

exit 1

fi

rm tmp_stp*.out

grep "zzz" $1 > tmp_stp1.out

unset j

while read line

do

i=$(echo $line|cut -d ' ' -f 3-7)

if ${j+"false"}

then

j=$i

else

## in this step we break the file into working piece with only necessary content using sed & awk

##first break the file into 1 sample @ a time

sed -n "/$j/,/$i/p" $1 >tmp_stp2.out;

##sort the file on field 11 to fix the start time issues like since "Jan 28" & for last 13:00:00 etc.. since both needs different processing.

sort -nk11 tmp_stp2.out >tmp_stp3.out;

csplit -z tmp_stp3.out /zzz/ '{*}' -f 'tmp_stp4_' >/dev/null 2>&1;

for a in $(ls -tr tmp_st4_*)

do

sed -i '/zzz/d' $a;

sed -i '/WCHAN/d' $a;

sed -r -i '/^\s*$/d' $a;

lncnt=$(cat $a|wc -l);

if [ ${lncnt} -gt 0 ]; then

chk1=$(head -1 $a|awk '{print $11}');

dt=$(date -d"$j" '+%d/%b/%Y %H:%M:%S');

if [[ "$chk1" =~ ^[a-zA-Z]+$ ]]; then

while read line2

do

tmpln=$(echo $line2|awk '{print $1","$2","$3","$4","$5","$6","$7","$8","$9","$10","$11"-"$12","$13}');

echo $dt","${tmpln}

done <$a

else

while read line2

do

tmpln=$(echo $line2|awk '{print $1","$2","$3","$4","$5","$6","$7","$8","$9","$10","$11","$12","$13}');

echo $dt","${tmpln}

done <$a

fi

fi

done

j=$i

fi

done <tmp_stp1.out


Step 3) document the above code flow diagram and write code information (kind of readme) using GENAI

Here we will use gemini… I pasted the output from gemini below after several prompts to make it accurarte


graph TD A(Start) --> B(Argument count = 1?); B -- No --> C[Display error]; C --> D[Exit]; B -- Yes --> E[Remove temp files]; E --> F[Filter zzz to temp file 1]; F --> G[Init j]; G --> H[Loop: Read line from temp file 1]; H --> I[i = fields 3-7]; I --> J(j set?); J -- No --> K[j = i]; J -- Yes --> L[Extract lines between j and i to temp file 2]; L --> M[Sort temp file 2 by field 11 to temp file 3]; M --> N[Split temp file 3 at zzz to temp files]; N --> O[Loop: Iterate temp files]; O --> P[Remove zzz, WCHAN, blank lines]; P --> Q[Count lines]; Q --> R(Line count > 0?); R -- Yes --> S[Get field 11]; S --> T[Get date]; T --> U(Field is letters?); U -- Yes --> V[Loop: Read line]; V --> W[Format line with j and modified field 11 to temp file 5]; W --> X[End loop]; X --> Y[End conditional]; U -- No --> AA[Loop: Read line]; AA --> AB[Format line with j to temp file 5]; AB --> AC[End loop]; AC --> Y; R -- No --> Y; Y --> AD[End loop]; AD --> AE[j = i]; AE --> AF[End conditional]; AF --> H; AF --> AG[End]; X --> V; AC --> AA; AD --> O;


Step 4) Invoke the script developed


sh processosstat.sh <inputfile> ><processed_output.file>


sh processosstat_noop.sh /tmp/psinfo2.out >processed_ps2.out


Output:

[oracle@vcentos79-oracle-sa1 OSpsstat]$ head -10 processed_ps2.out

13/Feb/2025 22:44:42,chrony,920,1,19,0.0,0.0,117808,1852,poll_schedule_timeout,S,11:51:53,00:00:00,/usr/sbin/chronyd

13/Feb/2025 22:44:42,dbus,915,1,19,0.0,0.0,66456,2584,ep_poll,S,11:51:53,00:00:00,/usr/bin/dbus-daemon

13/Feb/2025 22:44:42,oracle,11558,11548,19,0.0,0.0,163364,2672,poll_schedule_timeout,S,11:56:04,00:00:00,sshd:

13/Feb/2025 22:44:42,oracle,11559,11558,19,0.0,0.0,115680,2208,do_wait,S,11:56:04,00:00:00,-bash

13/Feb/2025 22:44:42,oracle,930,1,19,0.2,1.0,1180400,41332,futex_wait_queue_me,S,11:51:53,00:00:14,/u01/app/oracle/product/21.3.0/ogg_home_1/bin/ServiceManager

13/Feb/2025 22:44:42,polkitd,929,1,19,0.0,0.2,613016,9176,poll_schedule_timeout,S,11:51:53,00:00:00,/usr/lib/polkit-1/polkitd

13/Feb/2025 22:44:42,postfix,1984,1979,19,0.0,0.1,89976,4108,ep_poll,S,11:51:59,00:00:00,qmgr

13/Feb/2025 22:44:42,root,1,0,19,0.0,0.1,128280,6972,ep_poll,S,11:51:45,00:00:02,/usr/lib/systemd/systemd

13/Feb/2025 22:44:42,root,10,2,39,0.0,0.0,0,0,rescuer_thread,S,11:51:45,00:00:00,[lru-add-drain]

13/Feb/2025 22:44:42,root,11,2,139,0.0,0.0,0,0,smpboot_thread_fn,S,11:51:45,00:00:00,[watchdog/0]

[oracle@vcentos79-oracle-sa1 OSpsstat]$


Step 5) Now use your favourite tool include excel to perform analytics


This will be part 2 in our case.


Thank you!


No comments:

Post a Comment

Flashback data archive steps

 Objective: Ways to track DML changes in a table Detailed objective: We should be able to track the changes in the table at any point in tim...