EXPERIMENT: What happens when you drop cache in a oracle db linux server with no hugepages configured with ASMM (not AMM)
Step 1) Start the VM
Step 2) start the DB & perform health check
startup;
set lines 1200 pages 3000 colsep , time on timing on trim on trims on long 20000
alter session set nls_date_format='DD/MON/YYYY HH24:MI:SS';
select name,open_mode from v$database;
select distinct(status) from v$datafile;
select distinct(status) from dba_registry;
select distinct(status) from dba_indexes where owner in ('SYS','SYSTEM');
sho parameter sga;
sho parameter pga;
select pool,sum(bytes)/1024/1024 from v$sgastat group by pool order by 1;
Output:
SQL> startup ORACLE instance started. Total System Global Area 1577055360 bytes Fixed Size 9135232 bytes Variable Size 1409286144 bytes Database Buffers 150994944 bytes Redo Buffers 7639040 bytes Database mounted. Database opened. 23:18:50 SQL> select name,open_mode from v$database; NAME ,OPEN_MODE ---------,-------------------- ORA19C ,READ WRITE Elapsed: 00:00:00.01 23:18:55 SQL> select distinct(status) from v$datafile; STATUS ------- SYSTEM ONLINE Elapsed: 00:00:00.01 23:18:59 SQL> select distinct(status) from dba_registry; STATUS -------------------------------------------- VALID OPTION OFF Elapsed: 00:00:00.10 23:19:05 SQL> select distinct(status) from dba_indexes where owner in ('SYS','SYSTEM'); STATUS -------- VALID N/A Elapsed: 00:00:00.30 23:19:09 SQL> sho parameter sga; NAME ,TYPE ,VALUE ------------------------------------,-----------,------------------------------ allow_group_access_to_sga ,boolean ,FALSE lock_sga ,boolean ,FALSE pre_page_sga ,boolean ,TRUE sga_max_size ,big integer,1504M sga_min_size ,big integer,0 sga_target ,big integer,1504M unified_audit_sga_queue_size ,integer ,1048576 23:19:14 SQL> sho parameter mem NAME ,TYPE ,VALUE ------------------------------------,-----------,------------------------------ hi_shared_memory_address ,integer ,0 inmemory_adg_enabled ,boolean ,TRUE inmemory_automatic_level ,string ,OFF inmemory_clause_default ,string , inmemory_expressions_usage ,string ,ENABLE inmemory_force ,string ,DEFAULT inmemory_max_populate_servers ,integer ,0 inmemory_optimized_arithmetic ,string ,DISABLE inmemory_prefer_xmem_memcompress ,string , inmemory_prefer_xmem_priority ,string , inmemory_query ,string ,ENABLE inmemory_size ,big integer,0 inmemory_trickle_repopulate_servers_,integer ,1 percent , , inmemory_virtual_columns ,string ,MANUAL inmemory_xmem_size ,big integer,0 memoptimize_pool_size ,big integer,0 memory_max_target ,big integer,0 memory_target ,big integer,0 optimizer_inmemory_aware ,boolean ,TRUE shared_memory_address ,integer ,0 23:19:20 SQL> sho parameter pga; NAME ,TYPE ,VALUE ------------------------------------,-----------,------------------------------ pga_aggregate_limit ,big integer,2G pga_aggregate_target ,big integer,500M 23:19:42 SQL> select pool,sum(bytes)/1024/1024 from v$sgastat group by pool order by 1; POOL ,SUM(BYTES)/1024/1024 --------------,-------------------- large pool , 16 shared pool , 560 streams pool , 768 , 159.997192 Elapsed: 00:00:00.01 23:20:00 SQL> |
Step 3) Examine the SGA/PGA setting
already evaluated in last step
Step 4) Examine the memory distribution in linux
free -k
cat /proc/<pmon pid>/status
cat /proc/11447/status
Output:
[oracle@vcentos79-oracle-sa1 ~]$ free -k total used free shared buff/cache available Mem: 3880192 590796 164164 1534348 3125232 1706696 Swap: 3145724 0 3145724 [oracle@vcentos79-oracle-sa1 ~] [oracle@vcentos79-oracle-sa1 ~]$ cat /proc/11447/status Name: ora_pmon_ora19c Umask: 0022 State: S (sleeping) Tgid: 11447 Ngid: 0 Pid: 11447 PPid: 1 TracerPid: 0 Uid: 54321 54321 54321 54321 Gid: 54321 54321 54321 54321 FDSize: 64 Groups: 54321 54322 54323 54324 54325 54326 54330 VmPeak: 2000496 kB VmSize: 2000496 kB VmLck: 0 kB VmPin: 0 kB VmHWM: 24544 kB VmRSS: 24544 kB RssAnon: 3644 kB RssFile: 16096 kB RssShmem: 4804 kB VmData: 5228 kB VmStk: 140 kB VmExe: 371600 kB VmLib: 25788 kB VmPTE: 640 kB VmSwap: 0 kB Threads: 1 SigQ: 0/15064 SigPnd: 0000000000000000 ShdPnd: 0000000000000000 SigBlk: 0000000000000000 SigIgn: 0000000016400207 SigCgt: 00000003c9887cf8 CapInh: 0000000000000000 CapPrm: 0000000000000000 CapEff: 0000000000000000 CapBnd: 0000001fffffffff CapAmb: 0000000000000000 NoNewPrivs: 0 Seccomp: 0 Speculation_Store_Bypass: vulnerable Cpus_allowed: 1 Cpus_allowed_list: 0 Mems_allowed: 00000000,00000000,00000000,00000000,00000000,00000000,00000000,00000000,00000000,00000000,00000000,00000000,00000000,00000000,00000000,00000000,00000000,00000000,00000000,00000000,00000000,00000000,00000000,00000000,00000000,00000000,00000000,00000000,00000000,00000000,00000000,00000001 Mems_allowed_list: 0 voluntary_ctxt_switches: 438 nonvoluntary_ctxt_switches: 16 [oracle@vcentos79-oracle-sa1 ~]$ cat /proc/11447/status Name: ora_pmon_ora19c Umask: 0022 State: S (sleeping) Tgid: 11447 Ngid: 0 Pid: 11447 PPid: 1 TracerPid: 0 Uid: 54321 54321 54321 54321 Gid: 54321 54321 54321 54321 FDSize: 64 Groups: 54321 54322 54323 54324 54325 54326 54330 VmPeak: 2000496 kB VmSize: 2000496 kB VmLck: 0 kB VmPin: 0 kB VmHWM: 24544 kB VmRSS: 24544 kB RssAnon: 3644 kB RssFile: 16096 kB RssShmem: 4804 kB VmData: 5228 kB VmStk: 140 kB VmExe: 371600 kB VmLib: 25788 kB VmPTE: 640 kB VmSwap: 0 kB Threads: 1 SigQ: 0/15064 SigPnd: 0000000000000000 ShdPnd: 0000000000000000 SigBlk: 0000000000000000 SigIgn: 0000000016400207 SigCgt: 00000003c9887cf8 CapInh: 0000000000000000 CapPrm: 0000000000000000 CapEff: 0000000000000000 CapBnd: 0000001fffffffff CapAmb: 0000000000000000 NoNewPrivs: 0 Seccomp: 0 Speculation_Store_Bypass: vulnerable Cpus_allowed: 1 Cpus_allowed_list: 0 Mems_allowed: 00000000,00000000,00000000,00000000,00000000,00000000,00000000,00000000,00000000,00000000,00000000,00000000,00000000,00000000,00000000,00000000,00000000,00000000,00000000,00000000,00000000,00000000,00000000,00000000,00000000,00000000,00000000,00000000,00000000,00000000,00000000,00000001 Mems_allowed_list: 0 voluntary_ctxt_switches: 515 nonvoluntary_ctxt_switches: 21 [oracle@vcentos79-oracle-sa1 ~]$ |
Step 5) Initiate monitoring
vmstat 1 10000 -t
Step 6) Have the following log tailed
DB alert log [tail -10f <ORACLE_BASE>/../../trace/alert_<instance>.log
os messages [tail -10f /var/log/messages]
os dmesg [dmesg -L --follow]
Step 7) Drop the cache
sync; echo 3 > /proc/sys/vm/drop_caches
Output:
[root@vcentos79-oracle-sa1 ~]# date;sync; echo 3 > /proc/sys/vm/drop_caches Thu Aug 8 23:25:03 BST 2024 [root@vcentos79-oracle-sa1 ~]# |
Step 8) check all the logs, for the impact assessment
DB alert log [tail -10f <ORACLE_BASE>/../../trace/alert_<instance>.log
os messages [tail -10f /var/log/messages]
os dmesg [dmesg -L --follow]
Output:
DB alertlog: 2024-08-08 23:02:01.879000 +01:00 TABLE SYS.WRP$_REPORTS: ADDED INTERVAL PARTITION SYS_P1152 (5334) VALUES LESS THAN (TO_DATE(' 2024-08-09 01:00:00', 'SYYYY-MM-DD HH24:MI:SS', 'NLS_CALENDAR=GREGORIAN')) TABLE SYS.WRP$_REPORTS_DETAILS: ADDED INTERVAL PARTITION SYS_P1153 (5334) VALUES LESS THAN (TO_DATE(' 2024-08-09 01:00:00', 'SYYYY-MM-DD HH24:MI:SS', 'NLS_CALENDAR=GREGORIAN')) TABLE SYS.WRP$_REPORTS_TIME_BANDS: ADDED INTERVAL PARTITION SYS_P1156 (5333) VALUES LESS THAN (TO_DATE(' 2024-08-08 01:00:00', 'SYYYY-MM-DD HH24:MI:SS', 'NLS_CALENDAR=GREGORIAN')) 2024-08-08 23:26:38.601000 +01:00 Thread 1 advanced to log sequence 215 (LGWR switch) Current log# 2 seq# 215 mem# 0: /oradata/ORA19C/redo02.log ARC1 (PID:11532): Archived Log entry 143 added for T-1.S-214 ID 0x46bb77bc LAD:1 OS Messages: Aug 8 23:24:54 vcentos79-oracle-sa1 systemd: Started Session 12 of user root. Aug 8 23:25:03 vcentos79-oracle-sa1 kernel: bash (13415): drop_caches: 3 <<< cache drop statment Aug 8 23:27:10 vcentos79-oracle-sa1 dhclient[6944]: DHCPREQUEST on enp0s9 to 192.168.10.2 port 67 (xid=0x7614aadf) Aug 8 23:27:10 vcentos79-oracle-sa1 dhclient[6944]: DHCPACK from 192.168.10.2 (xid=0x7614aadf) dmesg: [ 18.680202] 21:56:53.893242 vminfo Error: Unable to connect to system D-Bus (2/3): D-Bus not installed [ 23.683855] 21:56:58.899406 vminfo Error: Unable to connect to system D-Bus (3/3): D-Bus not installed [ 1707.626670] bash (13415): drop_caches: 3 |
Step 9) Assess various results mainly vmstat output:
r b swpd free buff cache si so bi bo in cs us sy id wa st BST 0 0 0 191636 2104 3123888 0 0 0 4 2429 1932 0 1 99 0 0 23:24:59 1 0 0 191636 2104 3123888 0 0 0 4 2395 1947 0 0 100 0 0 23:25:00 0 0 0 181172 2104 3123888 0 0 8 56 2400 1999 4 3 93 0 0 23:25:01 0 0 0 181172 2104 3123904 0 0 0 4 2416 1991 0 1 99 0 0 23:25:02 0 0 0 181172 2104 3123904 0 0 4 4 2376 1935 0 0 100 0 0 23:25:03 << cache dropped 0 0 0 2585452 0 733348 0 0 52 189 2013 2082 1 31 68 0 0 23:25:04 0 0 0 2586320 0 732560 0 0 60 100 2364 2002 0 1 98 1 0 23:25:05 0 0 0 2586340 0 732560 0 0 0 4 2162 1839 1 0 99 0 0 23:25:06 0 0 0 2586216 0 732636 0 0 80 36 2232 1885 0 0 99 1 0 23:25:07 0 0 0 2586216 0 732672 0 0 0 4 2270 1881 0 0 100 0 0 23:25:08 0 0 0 2586216 0 732672 0 0 4 4 2281 1957 0 0 100 0 0 23:25:09 0 0 0 2586216 0 732676 0 0 0 36 2070 1754 1 0 99 0 0 23:25:10 0 0 0 2586216 0 732676 0 0 0 4 2416 1987 0 1 98 1 0 23:25:11 ... 0 0 0 2586216 0 732688 0 0 0 4 2303 1920 0 0 100 0 0 23:25:27 0 0 0 2586216 0 732688 0 0 0 36 2264 1871 0 0 100 0 0 23:25:28 0 0 0 2586216 0 732688 0 0 0 4 2285 1911 0 0 100 0 0 23:25:29 0 0 0 2586216 0 732688 0 0 0 4 2365 1887 0 1 99 0 0 23:25:30 3 0 0 2555468 0 762384 0 0 29724 36 2578 1985 0 5 92 2 0 23:25:31 0 0 0 2562480 0 767336 0 0 4948 4 2079 1737 1 4 94 1 0 23:25:32 0 0 0 2562480 0 767336 0 0 4 4 2288 1847 0 0 100 0 0 23:25:33 0 0 0 2562480 0 767340 0 0 0 40 2305 1922 0 0 100 0 0 23:25:34 0 0 0 2562480 0 767340 0 0 0 4 2228 1854 0 0 100 0 0 23:25:35 0 0 0 2562480 0 767340 0 0 0 4 2260 1912 1 0 99 0 0 23:25:36 0 0 0 2562480 0 767340 0 0 0 36 2315 1882 0 0 100 0 0 23:25:37 0 0 0 2562480 0 767340 0 0 0 4 2291 1851 0 0 100 0 0 23:25:38 0 0 0 2562480 0 767340 0 0 0 4 2360 1939 0 1 98 1 0 23:25:39 0 0 0 2562480 0 767568 0 0 84 428 2407 2066 1 0 98 1 0 23:25:40 2 0 0 2558880 0 771312 0 0 1253 79 2134 2169 4 2 94 0 0 23:26:35 3 0 0 2540508 0 785496 0 0 14136 36 2433 1992 3 2 95 0 0 23:26:36 1 1 0 2435948 0 893116 0 0 101988 4776 2801 2471 71 18 0 11 0 23:26:37 1 1 0 2246816 0 1056592 0 0 97982 16131 3452 4509 51 26 0 23 0 23:26:38 5 2 0 2193668 0 1109912 0 0 37640 60361 3035 3381 60 13 0 27 0 23:26:39 2 1 0 2119880 0 1178972 0 0 58456 7344 2946 3374 70 17 0 13 0 23:26:40 3 0 0 2073580 0 1221716 0 0 33992 7280 2708 3313 71 15 0 13 0 23:26:41 1 1 0 2049028 0 1237672 0 0 12912 232 1666 1750 91 5 0 3 0 23:26:42 2 0 0 2029220 0 1256760 0 0 12477 4876 2421 3327 79 9 1 11 0 23:26:43 0 0 0 2014556 0 1271260 0 0 11596 2788 2286 2712 42 11 38 9 0 23:26:44 0 0 0 2014556 0 1271300 0 0 0 38 2408 1950 0 0 100 0 0 23:26:45 |
before: [oracle@vcentos79-oracle-sa1 ~]$ free -k total used free shared buff/cache available Mem: 3880192 590796 164164 1534348 3125232 1706696 << pretty much a warmed up machine Swap: 3145724 0 3145724 [oracle@vcentos79-oracle-sa1 ~]$ POOL ,SUM(BYTES)/1024/1024 --------------,-------------------- large pool , 16 shared pool , 560 streams pool , 768 , 159.997192 after: [oracle@vcentos79-oracle-sa1 ~]$ free -k total used free shared buff/cache available Mem: 3880192 596076 2006456 615016 1277660 2620748 << cache is building up again Swap: 3145724 0 3145724 [oracle@vcentos79-oracle-sa1 ~]$ POOL ,SUM(BYTES)/1024/1024 --------------,-------------------- large pool , 16 shared pool , 560 streams pool , 768 , 159.997192 |
No change to oracle SGA composition.
Step 10) Summarize the observation
A. The cache drop didnt interrupt oracle db [we didnt have any load on the db]
B. The cache drop resulted in File system cache being dropped and rebuild [vmstat showed the evidence]
C. No swap activity observed
D. Oracle process wise memory breakup didnt change, nor oracle's SGA composition changed
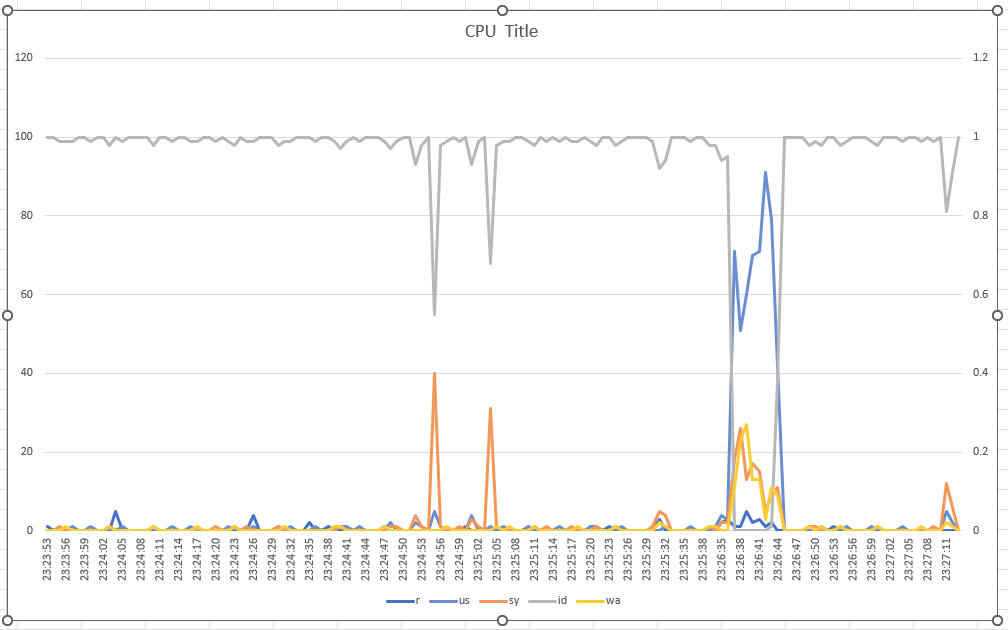
E. when the cache was dropped, there was a sudden raise in system CPU usage. Later when File syste cache started building up, there was lot of CPU chocking (user, system, io waits were observed).
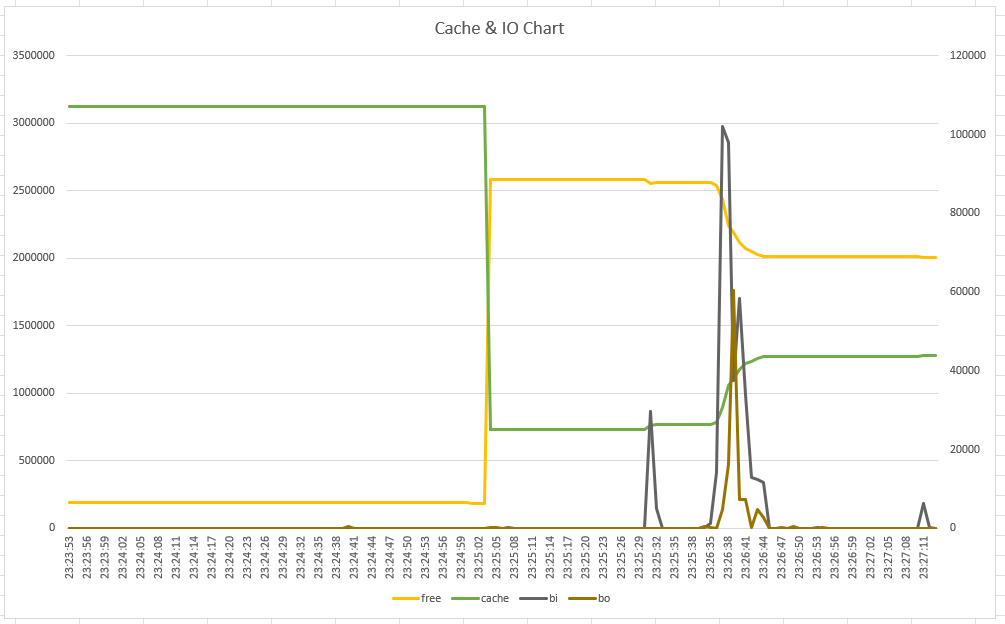
Step 11) Graphs:
Graph shows the memory flipping and leading to increase IO activity; cpu starvation.
YouTube:


No comments:
Post a Comment