Understanding Postgresql work_mem and temporary files & their impact on query performance
Notes from postgresql.org document:work_mem is the parameter which controls the amount of memory allocated to a sql for join,sort,merge and other complex analytical operations.
default 4MB. When the query demands more than this memory, the operation will spill over to disk.
In other dbs...
Oracle: PGA (a part of pga controls this allocation, you can individually upsize those memory like sort_area_size, hash_area_size)
MSSQL: It is tempdb; where this temporary file spillover happens when a query demands more than maxquerymemory statistics (a dynamic value derived when sql server is running). Min serialrequiredmemory is needed for query to start.
MSSQL: It is tempdb; where this temporary file spillover happens when a query demands more than maxquerymemory statistics (a dynamic value derived when sql server is running). Min serialrequiredmemory is needed for query to start.
Approach to test the impact:
If you wish to examine the temporary spillover to disk (aka if I am facing performance issues because of temp file coming into use when the work_mem is insufficient) - let us change work_mem as needed for the query.
1) Let us collect the metrics of pg_stat_database, this view displays the cummulative statistics of temp_files and temp_bytes used since cluster was created.
Query: select datid,datname dbname,temp_files,temp_bytes from pg_stat_database order by datid;
Actual result:
postgres=# select datid,datname dbname,temp_files,temp_bytes from pg_stat_database order by datid;
datid | dbname | temp_files | temp_bytes
-------+-----------+------------+------------
0 | | 0 | 0
1 | template1 | 0 | 0
14485 | template0 | 0 | 0
14486 | postgres | 19 | 191774720
16386 | pgbenchdb | 4 | 100253696
(5 rows)
postgres=#
2) Let us set some basic parameters before we kick off our testing...
postgres=# select name,setting from pg_settings where name like 'track%' order by 1;
name | setting
---------------------------+---------
track_activities | on
track_activity_query_size | 1024
track_commit_timestamp | off
track_counts | on
track_functions | none
track_io_timing | off <<< to be turned on
track_wal_io_timing | off <<< to be turned on
(7 rows)
name | setting
---------------------------+---------
track_activities | on
track_activity_query_size | 1024
track_commit_timestamp | off
track_counts | on
track_functions | none
track_io_timing | off <<< to be turned on
track_wal_io_timing | off <<< to be turned on
(7 rows)
postgres=# alter system set track_io_timing=on;
ALTER SYSTEM
postgres=# alter system set track_wal_io_timing=on;
ALTER SYSTEM
postgres=#
ALTER SYSTEM
postgres=# alter system set track_wal_io_timing=on;
ALTER SYSTEM
postgres=#
postgres=# select pg_reload_conf();
pg_reload_conf
----------------
t
(1 row)
pg_reload_conf
----------------
t
(1 row)
postgres=# select name,setting from pg_settings where name like 'track%' order by 1;
name | setting
---------------------------+---------
track_activities | on
track_activity_query_size | 1024
track_commit_timestamp | off
track_counts | on
track_functions | none
track_io_timing | on << enabled
track_wal_io_timing | on << enabled
(7 rows)
postgres=#
postgres=# alter system set log_statement_stats=true;
ALTER SYSTEM
postgres=# show log_statement_stats;
log_statement_stats
---------------------
off
(1 row)
postgres=# select pg_reload_conf();
pg_reload_conf
----------------
t
(1 row)
postgres=# show log_statement_stats;
log_statement_stats
---------------------
on
(1 row)
postgres=#
Test weather we get the stats logged:
2023-05-06 13:43:42.345 BST [10589] LOG: QUERY STATISTICS
2023-05-06 13:43:42.345 BST [10589] DETAIL: ! system usage stats:
! 0.000093 s user, 0.000052 s system, 0.000145 s elapsed
! [0.085281 s user, 0.047699 s system total]
! 14904 kB max resident size
! 0/8 [12864/1712] filesystem blocks in/out
! 0/0 [19/3564] page faults/reclaims, 0 [0] swaps
! 0 [0] signals rcvd, 0/0 [0/0] messages rcvd/sent
! 0/0 [310/1] voluntary/involuntary context switches
2023-05-06 13:43:42.345 BST [10589] STATEMENT: select 100;
3) Before we collect the stats, let us preserve the stats already available, remember postgres accumulates the stats.
I ran the below statements
create table bkp_stat_*_*
as
select * from pg_stat_*_*
where relname='test_shrbuf';
and
create table bkp_stat_statements
as
select * from pg_stat_statements;
as
select * from pg_stat_statements;
postgres=# create table bkp_stat_statements
postgres-# as
postgres-# select * from pg_stat_statements;
SELECT 413
postgres=#
postgres-# as
postgres-# select * from pg_stat_statements;
SELECT 413
postgres=#
So stats related to the table test_shrbuf are preserved here...
Schema | Name | Type | Owner | Persistence | Access method | Size | Description
--------+---------------------------------+-------------------+----------+-------------+---------------+------------+-------------
public | bkp_stat_database | table | postgres | permanent | heap | 8192 bytes |
public | bkp_stat_statements | table | postgres | permanent | heap | 208 kB |
public | bkp_stat_user_indexes | table | postgres | permanent | heap | 8192 bytes |
public | bkp_stat_user_tables | table | postgres | permanent | heap | 8192 bytes |
public | bkp_statio_all_indexes | table | postgres | permanent | heap | 8192 bytes |
public | bkp_statio_all_tables | table | postgres | permanent | heap | 8192 bytes |
4) Let us reset the stats
postgres=# select userid,count(1) from pg_stat_statements group by userid;
userid | count
--------+-------
16451 | 38
10 | 363
16819 | 24
(3 rows)
postgres=# show work_mem;
work_mem
----------
4MB
(1 row)
postgres=# select pg_stat_statements_reset();
pg_stat_statements_reset
--------------------------
(1 row)
pg_stat_statements_reset
--------------------------
(1 row)
postgres=# select userid,count(1) from pg_stat_statements group by userid;
userid | count
--------+-------
10 | 1
(1 row)
postgres=
userid | count
--------+-------
10 | 1
(1 row)
postgres=
But this doesnt impact other stats like pg_stat_database etc...
postgres=# select datid,datname dbname,temp_files,temp_bytes from pg_stat_database order by datid;
datid | dbname | temp_files | temp_bytes
-------+-----------+------------+------------
0 | | 0 | 0
1 | template1 | 0 | 0
14485 | template0 | 0 | 0
14486 | postgres | 19 | 191774720
16386 | pgbenchdb | 4 | 100253696
(5 rows)
postgres=#
5) Let us now run a basic query without any analytics with explain analyze
explain analyze
select count(1) from test_shrbuf;
Query output:
postgres=# explain analyze
postgres-# select count(1) from test_shrbuf;
QUERY PLAN
------------------------------------------------------------------------------------------------------------------------------------------------
Finalize Aggregate (cost=19542.55..19542.56 rows=1 width=8) (actual time=439.108..439.179 rows=1 loops=1)
-> Gather (cost=19542.34..19542.55 rows=2 width=8) (actual time=435.561..439.156 rows=3 loops=1)
Workers Planned: 2
Workers Launched: 2
-> Partial Aggregate (cost=18542.34..18542.35 rows=1 width=8) (actual time=393.437..393.438 rows=1 loops=3)
-> Parallel Seq Scan on test_shrbuf (cost=0.00..17500.67 rows=416667 width=0) (actual time=0.447..323.716 rows=333334 loops=3)
Planning Time: 0.594 ms
Execution Time: 439.307 ms
(8 rows)
Time: 440.946 ms
postgres=#
Query to examine the result:
select queryid
,substr(query,1,100) subqry
,calls
,total_exec_time
,rows
,shared_blks_hit
,shared_blks_read
,shared_blks_dirtied
,shared_blks_written
,temp_blks_read
,temp_blks_written
,blk_read_time
,blk_write_time
,wal_bytes
from pg_stat_statements
order by 2;
pg_stat_statements output:
,substr(query,1,100) subqry
,calls
,total_exec_time
,rows
,shared_blks_hit
,shared_blks_read
,shared_blks_dirtied
,shared_blks_written
,temp_blks_read
,temp_blks_written
,blk_read_time
,blk_write_time
,wal_bytes
from pg_stat_statements
order by 2;
pg_stat_statements output:
queryid | subqry | calls | total_exec_time | rows | shared_blks_hit | shared_blks_read | shared_blks_dirtied | shared_blks_written | temp_blks_read | temp_blks_written | blk_read_time | blk_write_time | wal_bytes
----------------------+------------------------------------------------------------------------------------------------------+-------+----------------------+------+-----------------+------------------+---------------------+---------------------+----------------+-------------------+---------------+----------------+-----------
6529820617763259118 | explain analyze +| 1 | 440.035061 | 0 | 67 | 13334 | 0 | 0 | 0 | 0 | 413.72747 | 0 | 0
| select count(1) from test_shrbuf | | | | | | | | | | | |
2023-05-06 14:12:17.734 BST [11177] DETAIL: ! system usage stats:
! 0.105378 s user, 0.046001 s system, 0.440689 s elapsed
! [0.106331 s user, 0.047907 s system total]
! 7244 kB max resident size
! 99744/8 [99744/8] filesystem blocks in/out
! 0/702 [0/1545] page faults/reclaims, 0 [0] swaps
! 0 [0] signals rcvd, 0/0 [0/0] messages rcvd/sent
! 8/11 [9/11] voluntary/involuntary context switches
2023-05-06 14:12:17.734 BST [11177] STATEMENT: explain analyze
select count(1) from test_shrbuf;
Try adding complexity: Aggregation and sorting...
explain analyze
select poscode
,count(1)
from test_shrbuf
group by poscode
order by 1;
Actual output:
postgres=# explain analyze
postgres-# select poscode
postgres-# ,count(1)
postgres-# from test_shrbuf
postgres-# group by poscode
postgres-# order by 1;
QUERY PLAN
------------------------------------------------------------------------------------------------------------------------------------------------------
Finalize GroupAggregate (cost=20622.56..20793.83 rows=676 width=15) (actual time=400.115..401.249 rows=676 loops=1)
Group Key: poscode
-> Gather Merge (cost=20622.56..20780.31 rows=1352 width=15) (actual time=400.106..400.827 rows=2028 loops=1)
Workers Planned: 2
Workers Launched: 2
-> Sort (cost=19622.54..19624.23 rows=676 width=15) (actual time=374.283..374.318 rows=676 loops=3)
Sort Key: poscode
Sort Method: quicksort Memory: 56kB
Worker 0: Sort Method: quicksort Memory: 56kB
Worker 1: Sort Method: quicksort Memory: 56kB
-> Partial HashAggregate (cost=19584.01..19590.77 rows=676 width=15) (actual time=372.012..372.105 rows=676 loops=3)
Group Key: poscode
Batches: 1 Memory Usage: 105kB
Worker 0: Batches: 1 Memory Usage: 105kB
Worker 1: Batches: 1 Memory Usage: 105kB
-> Parallel Seq Scan on test_shrbuf (cost=0.00..17500.67 rows=416667 width=7) (actual time=0.039..123.984 rows=333334 loops=3)
Planning Time: 0.152 ms
Execution Time: 401.397 ms
(18 rows)
Time: 402.121 ms
postgres=#
queryid | subqry | calls | total_exec_time | rows | shared_blks_hit | shared_blks_read | shared_blks_dirtied | shared_blks_written | temp_blks_read | temp_blks_written | blk_read_time | blk_write_time | wal_bytes
----------------------+------------------------------------------------------------------------------------------------------+-------+----------------------+------+-----------------+------------------+---------------------+---------------------+----------------+-------------------+---------------+----------------+-----------
6596019837031560406 | explain analyze +| 1 | 401.65296 | 0 | 127 | 13238 | 0 | 0 | 0 | 0 | 65.018125 | 0 | 0
| select poscode +| | | | | | | | | | | |
| ,count(1) +| | | | | | | | | | | |
| from test_shrbuf +| | | | | | | | | | | |
| group by poscode +| | | | | | | | | | | |
| order by 1 | | | | | | | | | | | |
2023-05-06 14:23:13.738 BST [11177] DETAIL: ! system usage stats:
! 0.136288 s user, 0.006803 s system, 0.401821 s elapsed
! [0.244912 s user, 0.056103 s system total]
! 9020 kB max resident size
! 0/8 [99744/32] filesystem blocks in/out
! 0/242 [0/1997] page faults/reclaims, 0 [0] swaps
! 0 [0] signals rcvd, 0/0 [0/0] messages rcvd/sent
! 1/13 [14/24] voluntary/involuntary context switches
2023-05-06 14:23:13.738 BST [11177] STATEMENT: explain analyze
select poscode
,count(1)
from test_shrbuf
group by poscode
order by 1;
procs -----------memory---------- ---swap-- -----io---- -system-- ------cpu----- -----timestamp-----
r b swpd free buff cache si so bi bo in cs us sy id wa st BST
0 0 0 3336168 2108 338460 0 0 0 0 43 69 0 0 100 0 0 2023-05-06 14:23:10
0 0 0 3336168 2108 338460 0 0 0 0 43 70 0 1 100 0 0 2023-05-06 14:23:12
0 0 0 3335176 2108 339228 0 0 0 0 257 103 18 2 80 0 0 2023-05-06 14:23:14 <<< free mem decreased by 1MB
0 0 0 3335176 2108 339228 0 0 0 0 41 70 0 0 100 0 0 2023-05-06 14:23:16
0 0 0 3335176 2108 339228 0 0 0 22 54 83 0 1 99 0 0 2023-05-06 14:23:18
We now have downsized the work_mem to 64kB.
postgres=# set work_mem=64;
SET
Time: 0.301 ms
postgres=# show work_mem;
work_mem
----------
64kB
(1 row)
Time: 0.284 ms
postgres=#
Let us see how the last aggregation performs, since it needs 105kB for the hash operation, but we have allocated 64kB only.
postgres=# explain analyze
postgres-# select poscode
postgres-# ,count(1)
postgres-# from test_shrbuf
postgres-# group by poscode
postgres-# order by 1;
QUERY PLAN
------------------------------------------------------------------------------------------------------------------------------------------------------
Finalize GroupAggregate (cost=20622.56..20793.83 rows=676 width=15) (actual time=647.735..648.924 rows=676 loops=1)
Group Key: poscode
-> Gather Merge (cost=20622.56..20780.31 rows=1352 width=15) (actual time=647.723..648.474 rows=2028 loops=1)
Workers Planned: 2
Workers Launched: 2
-> Sort (cost=19622.54..19624.23 rows=676 width=15) (actual time=613.160..620.374 rows=676 loops=3)
Sort Key: poscode
Sort Method: quicksort Memory: 56kB
Worker 0: Sort Method: quicksort Memory: 56kB
Worker 1: Sort Method: quicksort Memory: 56kB
-> Partial HashAggregate (cost=19584.01..19590.77 rows=676 width=15) (actual time=475.210..607.219 rows=676 loops=3)
Group Key: poscode
Batches: 5 Memory Usage: 97kB Disk Usage: 7560kB
Worker 0: Batches: 5 Memory Usage: 97kB Disk Usage: 7392kB
Worker 1: Batches: 5 Memory Usage: 97kB Disk Usage: 7200kB
-> Parallel Seq Scan on test_shrbuf (cost=0.00..17500.67 rows=416667 width=7) (actual time=0.109..116.748 rows=333334 loops=3)
Planning Time: 0.074 ms
Execution Time: 650.107 ms
(18 rows)
Time: 650.637 ms
postgres=#
Transposed pg_stat_statements output:
-[ RECORD 2 ]-------+-----------------------------------------------------------------------------------------------------
queryid | 6596019837031560406
subqry | explain analyze +
| select poscode +
| ,count(1) +
| from test_shrbuf +
| group by poscode +
| order by 1
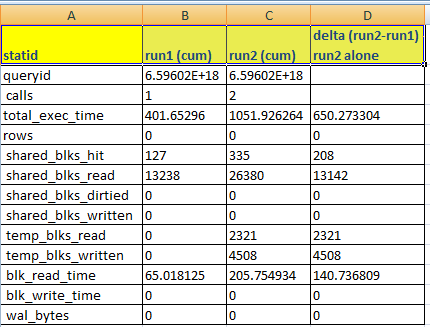
calls | 2 <<< number of calls is 2 (+1 from last time)
total_exec_time | 1051.9262640000002 <<< 600ms more from 400ms last run
rows | 0
shared_blks_hit | 335
shared_blks_read | 26380
shared_blks_dirtied | 0
shared_blks_written | 0
temp_blks_read | 2321 <<<< we read from disk
temp_blks_written | 4508 <<<< we read from disk
blk_read_time | 205.754934
blk_write_time | 0
wal_bytes | 0
A clear chart showing the delta below..
2023-05-06 14:32:40.980 BST [11177] DETAIL: ! system usage stats:
! 0.197883 s user, 0.031770 s system, 0.650436 s elapsed
! [0.443715 s user, 0.089167 s system total]
! 9796 kB max resident size
! 0/15120 [99744/15160] filesystem blocks in/out >>> look at the large # of blocks out here (earlier it was 8 512bytes pages, vs now 15120 512 byte pages, which is matching Disk Usage: 7560kB)
! 0/182 [0/2205] page faults/reclaims, 0 [0] swaps
! 0 [0] signals rcvd, 0/0 [0/0] messages rcvd/sent
! 0/21 [19/45] voluntary/involuntary context switches
2023-05-06 14:32:40.980 BST [11177] STATEMENT: explain analyze
select poscode
,count(1)
from test_shrbuf
group by poscode
order by 1;
procs -----------memory---------- ---swap-- -----io---- -system-- ------cpu----- -----timestamp-----
r b swpd free buff cache si so bi bo in cs us sy id wa st BST
0 0 0 3330212 2108 341448 0 0 0 0 60 80 0 0 100 0 0 2023-05-06 14:32:38
3 0 0 3304076 2108 365060 0 0 0 0 340 97 24 4 71 0 0 2023-05-06 14:32:40 <<< look at this stats (run queue#3 - with free dipping by 26MB & cache increase by 24MB)
0 0 0 3329296 2108 342360 0 0 0 0 83 78 2 1 97 0 0 2023-05-06 14:32:42 <<< look at this snap (the free and cache are returning back to their normal value)
Finally the new numbers from pg_stat_database:
postgres=# select datid,datname dbname,temp_files,temp_bytes from pg_stat_database order by datid;
datid | dbname | temp_files | temp_bytes
-------+-----------+------------+------------
0 | | 0 | 0
1 | template1 | 0 | 0
14485 | template0 | 0 | 0
14486 | postgres | 22 | 214458368 <<< this was (19 | 191774720, see now 3 temp_files were created for this db & temp_bytes grew as well)
16386 | pgbenchdb | 4 | 100253696
(5 rows)
Time: 11.373 ms
postgres=#
This shows the impact of work_mem on the query performance.
So a huge difference in performance.
Thanks


No comments:
Post a Comment