Sunday, August 14, 2022

Breakup of Oracle Foreground and Background wait class metrics history from AWR views

 Dear Readers,

In this blog, we are going to look at the possibilities of reporting the foreground and background wait class metrics. Oracle in the AWR doesnt report the foreground and background wait class metrics separately, it only reports the foreground metrics by wait class; but not the background.

So I wrote a sql analytic query based on dba_hist_system_event view to report the metrics...

Query:

with t as
(
select /*+ materialize */ snap_id
,wait_class
,sum(total_waits) totwts
,sum(time_waited_micro) tmwt
,sum(total_waits_fg) totwtsfg
,sum(time_Waited_micro_fg) tmwtfg
,(sum(total_waits)-sum(total_waits_fg)) totwtsbg
,(sum(time_waited_micro)-sum(time_waited_micro_fg)) tmwtbg
from dba_hist_system_event
group by snap_id
,wait_class
)
select t.wait_class
,(t.totwts-a.totwts) total_waits
,(t.tmwt-a.tmwt) total_time_waited_us
,(t.totwtsfg-a.totwtsfg) total_waits_fg
,(t.tmwtfg-a.tmwtfg) time_waited_fg_us
,(t.totwtsbg-a.totwtsbg) total_waits_bg
,(t.tmwtbg-a.tmwtbg) time_waited_bg_us
from
t ,t a
where t.snap_id=18
and a.snap_id=(t.snap_id-1)
and a.wait_Class=t.wait_class
order by 1,2;

Result:

WAIT_CLASS                    ,TOTAL_WAITS,TOTAL_TIME_WAITED_US,TOTAL_WAITS_FG,TIME_WAITED_FG_US,TOTAL_WAITS_BG,TIME_WAITED_BG_US
------------------------------,-----------,--------------------,--------------,-----------------,--------------,-----------------
Administrative                ,         32,                 189,            32,              189,             0,               0
Application                   ,         17,               24645,            17,            24645,             0,               0
Commit                        ,      26770,            84755489,         26759,         84639135,            11,          116354
Concurrency                   ,          2,               25996,             0,                0,             2,           25996
Configuration                 ,         13,              922471,            13,           922471,             0,               0
Idle                          ,     168764,          1.1192E+11,        105007,       5855698235,         63757,       1.0606E+11
Network                       ,     120130,             1099890,        120024,          1099821,           106,              69
Other                         ,       6035,            76421612,          4793,           696732,          1242,        75724880
Scheduler                     ,          0,                   0,             0,                0,             0,               0
System I/O                    ,      40147,           119983483,          1009,            93039,         39138,       119890444
User I/O                      ,       5086,             5884585,          4479,          2866115,           607,         3018470

11 rows selected.

So you can see above the breakup of the wait class information by foreground and background processes.

AWR report sample (Showing the total waits and time waited information in total - not classified by fg or bg process):

Wait Classes by Total Wait Time
~~~~~~~~~~~~~~~~~~~~~~~~~~~~~~~
                                                          Avg             Avg
                                        Total Wait       Wait   % DB   Active
Wait Class                  Waits       Time (sec)       Time   time Sessions
---------------- ---------------- ---------------- ---------- ------ --------
System I/O                 40,147              120     2.99ms   90.7      0.1
Commit                     26,770               85     3.17ms   64.1      0.0
Other                       6,035               76    12.66ms   57.8      0.0
DB CPU                                          42              31.7      0.0
User I/O                    5,086                6     1.16ms    4.4      0.0
Network                   120,130                1     9.16us     .8      0.0
Configuration                  13                1    70.96ms     .7      0.0
Concurrency                     2                0    13.00ms     .0      0.0
Application                    17                0     1.45ms     .0      0.0
Administrative                 32                0     5.91us     .0      0.0

AWR report sample (Showing the total waits and time waited information in total - only for fg):


Foreground Wait Class                 DB/Inst: ORA19C01/ORA19C01  Snaps: 17-18
-> s  - second, ms - millisecond, us - microsecond, ns - nanosecond
-> ordered by wait time desc, waits desc
-> %Timeouts: value of 0 indicates value was < .5%.  Value of null is truly 0
-> Captured Time accounts for        100.0%  of Total DB time         132.30 (s)
-> Total FG Wait Time:                90.34 (s)  DB CPU time:          42.00 (s)

                                     %Time      Total Wait
Wait Class                     Waits -outs        Time (s)   Avg wait  %DB time
-------------------- --------------- ----- --------------- ---------- ---------
Commit                        26,759     0              85     3.16ms      64.0
DB CPU                                                  42                 31.7
User I/O                       4,479     0               3   639.90us       2.2
Network                      120,024     0               1     9.16us       0.8
Configuration                     13     0               1    70.96ms       0.7
Other                          4,793     0               1   145.36us       0.5
System I/O                     1,009     0               0    92.21us       0.1
Application                       17     0               0     1.45ms       0.0
Administrative                    32     0               0     5.91us       0.0
Concurrency                        0                     0                  0.0
                          ------------------------------------------------------

If you read the line "-> Captured Time accounts for        100.0%  of Total DB time         132.30 (s)". Oracle AWR doesnt account for bg process times in the db time metrics, the same applies for DB CPU metric as well. Background process spends are measured separately.

Then why would some one be interested in the background process wait_class metric information.
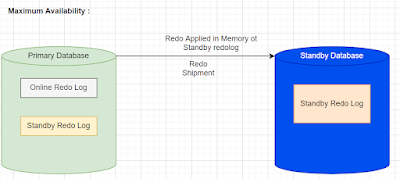
In my DB during a hammerDB load test, the system was chocked with system I/O class of wait events aka "log file parallel write & Redo Transport Attach", since my machine had archivelog & standby enabled. Also @ the os end I saw a lot of system and IO waits, I didnt store vmstat result, but you can see below the sar report (averaged out!!!) over 10 mins time showing a significant increase in system cpu usage.

                                                Total
                                       %Time     Wait              Waits   % bg
Event                            Waits -outs Time (s)  Avg wait     /txn   time
-------------------------- ----------- ----- -------- --------- -------- ------
log file parallel write         28,790     0       90    3.13ms      1.1   39.1
Redo Transport Attach                6     0       72   12.03 s      0.0   31.3


02:20:01 AM     CPU     %user     %nice   %system   %iowait    %steal     %idle
02:30:01 AM     all      0.27      0.00      4.53      0.17      0.00     95.04  <<< this is the window the test ran
02:40:01 AM     all      0.04      0.00      0.66      0.13      0.00     99.17


Hope this helps!

Thank you!

Saturday, August 6, 2022

User managed backup and redo size growth

 Dear Readers,


As per oracle document, when you perform user managed backup using 
BEGIN BACKUP at database or tablespace level, your expected to generate more redo (since we will include the image of the full block undergoing change, since the user managed backup tool doesnt understand the dbfile architecture - might create fractured block in backup) compared to using RMAN to perform the same backup.

So I wanted to test that...

Test platform details:

Oracle Version: 19.3.0
DB Type: Standalone x86_64
Os: Linux

In session 1:

  1  create table t1 as
  2  select level lvl,mod(level,3) mdlvl3,mod(level,4) mdlvl4
  3  from dual
  4* connect by level<10000
SQL> /
Table created.

In session 2:

SQL> alter system flush buffer_cache;

System altered.

SQL> alter system flush shared_pool;

System altered.

SQL> select distinct(Status) from v$backup;

STATUS
------------------
NOT ACTIVE

In session 1 back:

SQL> set autotrace trace statistics
SQL> update t1 set mdlvl3=20;

9999 rows updated.


Statistics
----------------------------------------------------------
         95  recursive calls
        156  db block gets
        141  consistent gets
         38  physical reads
     949056  redo size
        195  bytes sent via SQL*Net to client
        374  bytes received via SQL*Net from client
          1  SQL*Net roundtrips to/from client
         10  sorts (memory)
          0  sorts (disk)
       9999  rows processed

SQL> commit;

Commit complete.

So we see it is only 949K or so redo generated.

In session 2 again:

SQL> alter system flush buffer_cache;

System altered.

SQL> alter system flush shared_pool;

System altered.

SQL> select distinct(Status) from v$backup;

STATUS
------------------
NOT ACTIVE

SQL> alter database begin backup;

Database altered.

SQL> select distinct(Status) from v$backup;

STATUS
------------------
ACTIVE

In session 1 again:

SQL> set autotrace trace statistics
SQL> update t1 set mdlvl3=30;

9999 rows updated.


Statistics
----------------------------------------------------------
         55  recursive calls
        158  db block gets
        139  consistent gets
         37  physical reads
    1134532  redo size
        195  bytes sent via SQL*Net to client
        374  bytes received via SQL*Net from client
          1  SQL*Net roundtrips to/from client
         10  sorts (memory)
          0  sorts (disk)
       9999  rows processed

SQL> commit;

Commit complete.

This time 1.1M redo bytes generated, this ideally should be the full image of the block which are undergoing change.

In session 2 again:

SQL> alter database end backup;

Database altered.

SQL> select distinct(Status) from v$backup;

STATUS
------------------
NOT ACTIVE

SQL> alter system flush shared_pool;

System altered.

SQL> alter system flush buffer_cache;

System altered.

In session 1 again:

SQL> set autotrace trace statistics
SQL> update t1 set mdlvl3=40;

9999 rows updated.


Statistics
----------------------------------------------------------
         89  recursive calls
        158  db block gets
        141  consistent gets
         37  physical reads
     949164  redo size
        195  bytes sent via SQL*Net to client
        374  bytes received via SQL*Net from client
          1  SQL*Net roundtrips to/from client
         10  sorts (memory)
          0  sorts (disk)
       9999  rows processed

SQL> commit;

Commit complete.

SQL>

In session 2 again:

SQL> alter system flush buffer_cache;

System altered.

SQL> alter system flush shared_pool;

System altered.

SQL> alter database begin backup;

Database altered.

SQL> select distinct(Status) from v$backup;

STATUS
------------------
ACTIVE

In session 1 again:

SQL> set autotrace trace statistics
SQL> update t1 set mdlvl3=30;

9999 rows updated.


Statistics
----------------------------------------------------------
         55  recursive calls
        156  db block gets
        139  consistent gets
         37  physical reads
    1134400  redo size
        195  bytes sent via SQL*Net to client
        374  bytes received via SQL*Net from client
          1  SQL*Net roundtrips to/from client
         10  sorts (memory)
          0  sorts (disk)
       9999  rows processed

SQL> commit;

Commit complete.

SQL>

So we repeated the same update 4 times, 2 times in "BACKUP" mode and other 2 times normally.
In all the scenario when we had "BACKUP" mode active, the amount of redo size is 1.1M vs "NO ACTIVE BACKUP" mode, the size is 949K.

So this confirms oracle's document and expected behaviour.

Thanks

Wednesday, February 9, 2022

Standby setup in oracle 19c using active database duplication (no OMF or ASM)

Objective of this exercise:
Setup a standby database using active database duplication in oracle 19c. The database isnt using OMF or ASM.

oracle document used for reference: https://docs.oracle.com/en/database/oracle/oracle-database/19/sbydb/creating-oracle-data-guard-physical-standby.html#GUID-0DC30726-3471-4588-BFE0-9CA0736328E2

Create an example primary db:
dbca -silent -createDatabase -templateName General_Purpose.dbc -gdbname ORA19C01 -sid ORA19C01 -responseFile NO_VALUE -characterSet AL32UTF8 -sysPassword <syspass> -systemPassword <systempass> -databaseType MULTIPURPOSE -automaticMemoryManagement false -totalMemory 2000 -storageType FS -datafileDestination /oradata  -redoLogFileSize 50 -emConfiguration NONE -ignorePreReqs

Setting up the primary DB for dataguard setup:
1) Enable appropriate logging (there are other 2 modes available as well, which is an enhancement to support batch loads)

SQL> alter database force logging;
Database altered.

SQL> select name,open_mode,database_role,log_mode,force_logging from v$database;
NAME      OPEN_MODE            DATABASE_ROLE    LOG_MODE     FORCE_LOGG
--------- -------------------- ---------------- ------------ ----------
ORA19C01  READ WRITE           PRIMARY          NOARCHIVELOG YES
SQL>

2) Configure redo transport authentication:

setup the below params:
log_archive_dest_n
fal_server

3) Add necessary standby redologs
Always add g+1 number of standby logfile. Where g is the numbe of redologs found in primary.
alter database add standby logfile ('<path>') size 50M;

4) Setup initialization params on primary db (supports both primary and standby role)

primary: chicago
standby: boston

Primary role params:
DB_NAME=chicago
DB_UNIQUE_NAME=chicago
LOG_ARCHIVE_CONFIG='DG_CONFIG=(chicago,boston)'
CONTROL_FILES='/arch1/chicago/control1.ctl', '/arch2/chicago/control2.ctl'
LOG_ARCHIVE_DEST_1=
 'LOCATION=USE_DB_RECOVERY_FILE_DEST 
  VALID_FOR=(ALL_LOGFILES,ALL_ROLES)
  DB_UNIQUE_NAME=chicago'
LOG_ARCHIVE_DEST_2=
 'SERVICE=boston ASYNC
  VALID_FOR=(ONLINE_LOGFILES,PRIMARY_ROLE) 
  DB_UNIQUE_NAME=boston'
REMOTE_LOGIN_PASSWORDFILE=EXCLUSIVE
LOG_ARCHIVE_FORMAT=%t_%s_%r.arc

Standby role params:
FAL_SERVER=boston
DB_FILE_NAME_CONVERT='/boston/','/chicago/'
LOG_FILE_NAME_CONVERT='/boston/','/chicago/' 
STANDBY_FILE_MANAGEMENT=AUTO

Actual:
alter system set LOG_ARCHIVE_CONFIG='DG_CONFIG=(ORA19C01,ORA19C01SB1)';
alter system set LOG_ARCHIVE_DEST_1='LOCATION=USE_DB_RECOVERY_FILE_DEST VALID_FOR=(ALL_LOGFILES,ALL_ROLES) DB_UNIQUE_NAME=ORA19C01';
alter system set LOG_ARCHIVE_DEST_2='SERVICE=ORA19C01SB1 ASYNC VALID_FOR=(ONLINE_LOGFILES,PRIMARY_ROLE) DB_UNIQUE_NAME=ORA19C01SB1';
alter system set LOG_ARCHIVE_FORMAT='ORA19C01_%t_%s_%r.arc' scope=spfile;

alter system set FAL_SERVER=ORA19C01SB1;
alter system set DB_FILE_NAME_CONVERT='/ORA19C01SB1/','/ORA19C01/' scope=spfile;
alter system set LOG_FILE_NAME_CONVERT='/ORA19C01SB1/','/ORA19C01/' scope=spfile;
alter system set STANDBY_FILE_MANAGEMENT=AUTO;

5) Create a Backup Copy of the Primary Database Data Files
6) Create a Control File for the Standby Database
7) Create a Parameter File for the Standby Database
8) Copy Files from the Primary System to the Standby System

Note:The steps 5 through 8 will be done using active database cloning.

9) Set Up the Environment to Support the Standby Database

a) Add /etc/oratab entry

standby:
[oracle@localhost dbs]$ tail -1 /etc/oratab
ORA19C01SB1:/u01/app/oracle/product/19.0.0/db_1:N
[oracle@localhost dbs]$

b) Copy password file from primary to standby

Primary:
[oracle@localhost dbs]$ cp orapwORA19C01 orapwORA19C01SB1
[oracle@localhost dbs]$ scp orapwORA19C01SB1 oracle@192.168.50.5:/u01/app/oracle/product/19.0.0/db_1/dbs
oracle@192.168.50.5's password:
orapwORA19C01SB1                                                             100% 2048   236.6KB/s   00:00
[oracle@localhost dbs]$


c) Make static entry in listener & tns entry for both the primary and standby in both the servers

Standby listener:
SID_LIST_LISTENER =
  (SID_LIST =
    (SID_DESC =
      (GLOBAL_DBNAME = ORA19C01SB1)
      (ORACLE_HOME = /u01/app/oracle/product/19.0.0/db_1)
      (SID_NAME = ORA19C01SB1)
    )
  )

Primary listener:
SID_LIST_LISTENER =
  (SID_LIST =
    (SID_DESC =
      (GLOBAL_DBNAME = ORA19C01)
      (ORACLE_HOME = /u01/app/oracle/product/19.0.0/db_1)
      (SID_NAME = ORA19C01)
    )
  )

Both tnsnames.ora:
ORA19C01 =
  (DESCRIPTION =
    (ADDRESS = (PROTOCOL = TCP)(HOST = 192.168.50.4)(PORT = 1521))
    (CONNECT_DATA =
      (SERVER = DEDICATED)
      (SERVICE_NAME = ORA19C01)
    )
  )
ORA19C01SB1 =
  (DESCRIPTION =
    (ADDRESS = (PROTOCOL = TCP)(HOST = 192.168.50.5)(PORT = 1521))
    (CONNECT_DATA =
      (SERVER = DEDICATED)
      (SERVICE_NAME = ORA19C01SB1)
    )
  )

d) Add only db_name and db_unique_name parameter and startup nomount the standby database

[oracle@localhost dbs]$ cat initORA19C01SB1.ora
db_name=ORA19C01
db_unique_name=ORA19C01SB1
[oracle@localhost dbs]$

SQL> select instance_name,status from v$instance;
INSTANCE_NAME    STATUS
---------------- ------------
ORA19C01SB1      STARTED

e) start the local listener if not done already in both primary and standby
f) Create the dump destination and controlfile, datafile, redologfile directories manually. Since we arent using ASM or OMF

primary:
[oracle@localhost dbs]$ find /oradata|grep -Ev ".dbf|.log|.ctl|mf"
/oradata
/oradata/ORA19C01
/oradata/ORA19C01/archives
/oradata/ORA19C01/archives/ORA19C01
[oracle@localhost dbs]$

Standby:
[oracle@localhost oradata]$ find /oradata
/oradata
/oradata/ORA19C01SB1
/oradata/ORA19C01SB1/archives
/oradata/ORA19C01SB1/archives/ORA19C01SB1
[oracle@localhost oradata]$

Location of controlfile, datafile, redologfile: /oradata/ORA19C01SB1
Location of archives: /oradata/ORA19C01SB1/archives/ORA19C01SB1
adump: /u01/app/oracle/admin/ORA19C01SB1/adump

10) Frame the active database duplication command
reference: https://docs.oracle.com/en/database/oracle/oracle-database/19/sbydb/creating-data-guard-standby-database-using-RMAN.html#GUID-C713FD5C-3375-45E4-A78F-4063006DAC5B

ex:
DUPLICATE TARGET DATABASE
  FOR STANDBY
  FROM ACTIVE DATABASE
  DORECOVER
  SPFILE
    SET "db_unique_name"="foou" COMMENT "Is a duplicate"
    SET LOG_ARCHIVE_DEST_2="service=inst3 ASYNC REGISTER
     VALID_FOR=(online_logfile,primary_role)"
    SET FAL_SERVER="inst1" COMMENT "Is primary"
  NOFILENAMECHECK;

Actuals:

File: sbysetup.cmd
Contents:
DUPLICATE TARGET DATABASE
  FOR STANDBY
  FROM ACTIVE DATABASE
  DORECOVER
  SPFILE
    PARAMETER_VALUE_CONVERT='ORA19C01','ORA19C01SB1'
    SET "db_name"="ORA19C01"
    SET "db_unique_name"="ORA19C01SB1"
    SET DB_FILE_NAME_CONVERT='/ORA19C01/','/ORA19C01SB1/'
    SET LOG_FILE_NAME_CONVERT='/ORA19C01/','/ORA19C01SB1/'
    SET LOG_ARCHIVE_DEST_2="service=ORA19C01 ASYNC REGISTER
     VALID_FOR=(online_logfile,primary_role)"
    SET FAL_SERVER="ORA19C01"
  NOFILENAMECHECK;

Notes:
db_file_name_convert & log_file_name_convert arent required in case you use OMF. Ensure to unset this params in source as well, otherwise you will recieve an RMAN- error.
db_name param is needed in the duplicate command, since your using PARAMETER_VALUE_CONVERT keyword in the duplicate command.

11) Make service based test connection to both primary and standby, if required stop the firewall on the host or make necessary exceptions.

12) Frame a shell script to call the command we framed above....
File: sbysetup.sh
Contents:
cd /home/oracle/dba/SbySetup;
export ORACLE_SID=ORA19C01SB1;export ORAENV_ASK=NO;. oraenv >/dev/null 2>&1;
rman target sys/sys@ORA19C01 auxiliary sys/sys@ORA19C01SB1 cmdfile=sbysetup.cmd log=sbysetup_duplicate.log

13) Invoke the shell script:
nohup sh sbysetup.sh > nh_sbysetup.out &

14) Wait for the duplicate command to finish

15) Verify the output:

Output:
[oracle@localhost SbySetup]$ head -5 sbysetup_duplicate.log
Recovery Manager: Release 19.0.0.0.0 - Production on Wed Feb 9 23:25:59 2022
Version 19.3.0.0.0
Copyright (c) 1982, 2019, Oracle and/or its affiliates.  All rights reserved.
[oracle@localhost SbySetup]$ head -10 sbysetup_duplicate.log
Recovery Manager: Release 19.0.0.0.0 - Production on Wed Feb 9 23:25:59 2022
Version 19.3.0.0.0
Copyright (c) 1982, 2019, Oracle and/or its affiliates.  All rights reserved.
connected to target database: ORA19C01 (DBID=3909934395)
connected to auxiliary database: ORA19C01 (not mounted)
RMAN> DUPLICATE TARGET DATABASE
[oracle@localhost SbySetup]$ tail -4 sbysetup_duplicate.log
Finished Duplicate Db at 09-FEB-22
Recovery Manager complete.
---

[oracle@localhost SbySetup]$ grep -iE "RMAN-|ORA-" sbysetup_duplicate.log
[oracle@localhost SbySetup]$

16) Verify file locations:
SQL> select name from v$datafile;
NAME
----------------------------------
/oradata/ORA19C01SB1/system01.dbf
/oradata/ORA19C01SB1/sysaux01.dbf
/oradata/ORA19C01SB1/undotbs01.dbf
/oradata/ORA19C01SB1/users01.dbf
SQL> select member from v$logfile;
MEMBER
----------------------------------
/oradata/ORA19C01SB1/redo03.log
/oradata/ORA19C01SB1/redo02.log
/oradata/ORA19C01SB1/redo01.log
SQL> select name from v$controlfile;
NAME
------------------------------------
/oradata/ORA19C01SB1/control01.ctl
/oradata/ORA19C01SB1/control02.ctl
SQL> select name from v$tempfile;
NAME
--------------------------------
/oradata/ORA19C01SB1/temp01.dbf
SQL>

[oracle@localhost SbySetup]$

17) There is no automatic recovery initated by the duplication command, hence we manually kick off the recovery..

command: ALTER DATABASE RECOVER MANAGED STANDBY DATABASE DISCONNECT FROM SESSION;


SQL> ALTER DATABASE RECOVER MANAGED STANDBY DATABASE DISCONNECT FROM SESSION;
Database altered.

SQL> select process,pid,status,client_process from v$managed_standby;
PROCESS   PID                      STATUS       CLIENT_P
--------- ------------------------ ------------ --------
DGRD      14968                    ALLOCATED    N/A
ARCH      14970                    CONNECTED    ARCH
DGRD      14972                    ALLOCATED    N/A
ARCH      14974                    CONNECTED    ARCH
ARCH      14976                    CONNECTED    ARCH
ARCH      14978                    CONNECTED    ARCH
RFS       15576                    IDLE         UNKNOWN
RFS       15578                    IDLE         LGWR
RFS       15581                    IDLE         Archival
MRP0      15790                    WAIT_FOR_LOG N/A
10 rows selected.

SQL> /
PROCESS   PID                      STATUS       CLIENT_P  SEQUENCE#
--------- ------------------------ ------------ -------- ----------
DGRD      14968                    ALLOCATED    N/A               0
ARCH      14970                    CONNECTED    ARCH              0
DGRD      14972                    ALLOCATED    N/A               0
ARCH      14974                    CONNECTED    ARCH              0
ARCH      14976                    CONNECTED    ARCH              0
ARCH      14978                    CONNECTED    ARCH              0
RFS       15576                    IDLE         UNKNOWN           0
RFS       15578                    IDLE         LGWR             32
RFS       15581                    IDLE         Archival          0
MRP0      15790                    WAIT_FOR_LOG N/A              32
10 rows selected.

cmd: ALTER DATABASE RECOVER MANAGED STANDBY DATABASE CANCEL;

SQL> ALTER DATABASE RECOVER MANAGED STANDBY DATABASE CANCEL;
Database altered.
SQL>

The recovery is cancelled.

Thanks

Wednesday, June 2, 2021

Use python to plot graphs from csv file - simple example

Excercise: Try plotting the data from csv file using python and save the plot to a jpeg or png file, which we can later make it available for other apps.

csvfile name: test.csv

Location: Current working directory

Python version: 2.7.5

Modules used: matplotlib, numpy

Code:

import numpy as np
import matplotlib
matplotlib.use('Agg')
import matplotlib.pyplot as plt
data = np.genfromtxt("test.csv", delimiter=",", names=["x", "y"])
plt.plot(data['x'], data['y'])
plt.savefig('/tmp/test1.png')

Code explanation:

numpy is needed to read the file in this example
matplotlib is needed for plotting the chart
matplotlib.use('Agg') is needed to supress the requirement of working DISPLAY variable


csv content:

1,2
2,5
3,7
4,7
5,9
6,10
7,20
8,21
9,22
10,30

Output:


Thank you


Wednesday, April 14, 2021

Run Jobs in parallel using Linux Shell Script (multiple loaders)

Objective: 

We have job description in the form of a string contained in a file called job.queue. 
Each string corresponds to a job itself.
We have a lot of jobs in the file job.queue.
If we run them in sequential mode, it will take a lot of time.
We would like to parallelise them using linux shell script here to reduce the overall job run time.

Lab setup:

OS: Centos 7.9.2009
Directory needed: ~/ptest
Files: job.queue, actual script file,job.parallel

Code to create job.queue:

cd ~/ptest;
cat /dev/null > job.queue;
for i in {1..50000}
do
echo job${i} >> job.queue;
done
echo 10 >job.parallel;


Code to launch the jobs in parallel:

cd ~/ptest;

#!/bin/ksh
#code for parallel processing - model 2
cd ~/ptest;
cat /dev/null > job.processed;
cat /dev/null > job.tracker;
cat /dev/null > job.lock;
ldcnt=5;
export ldcnt;
#Module to reset all operational files to the count of loaders.
for i in $(eval echo "{1..${ldcnt}}")
do
cat /dev/null > job.processed.th${i};
cat /dev/null > job.tracker.th${i};
cat /dev/null > job.lock.th${i};
rm job.parallel.th${i} >/dev/null 2>&1;
rm job.queue.th${i} >/dev/null 2>&1;
done
if ! [ -f job.parallel ];
then
    echo 1 > job.parallel;
fi
fsq()
{
exec 200>job.lock.${thn};
while true
do
    flock -xn 200 && break || sleep .01;
done
echo $key1,processed >> job.processed.${thn};
200>&-
}
loader()
{
typeset -i i;
i=0;
while read line
do
    pth=$(cat job.parallel.${thn});
    if [ $i -ge ${pth} ];
    then
        while true
        do
            if [ $i -lt ${pth} ];
            then
                break;
            else
                sleep .01;
                i=$(ps -ef|grep -i fsq|grep ${thn}|grep -v grep|wc -l);
            fi
        done
    fi
    ((i++));
    key1=$line;
    export -f fsq;
    export key1;
    { nohup bash -c fsq ${thn} & } >/dev/null 2>&1;
    jid=$(echo $!);
    echo $line - submitted under $jid|tee -a job.tracker.${thn};
done < job.queue.${thn}
}
#Module to launch the loaders
typeset -i j;
j=0;
#Module to break the work unit
lcnt=$(cat job.queue|wc -l);
spltcnt=$(echo "scale=0; $(bc -l <<< ${lcnt}+${ldcnt}-1)/${ldcnt}"|bc);
awk -v s=${spltcnt} 'NR%s==1 { file = FILENAME  ".th" sprintf("%d", (NR/s)+1) } { print > file }' job.queue;
#parallel thread distributor
pth=$(cat job.parallel);
typeset -i m;
m=0;
if [ ${pth} -ge ${ldcnt} ];
then
    for l in $(eval echo "{1..${pth}}")
    do
        ((m++));
        if [ -f job.parallel.th${m} ];
        then
            cupval=$(cat job.parallel.th${m});
            newval=$(bc -l <<< ${cupval}+1);
            echo ${newval} > job.parallel.th${m};
        else
            echo 1 > job.parallel.th${m};
        fi
        if [ ${m} -ge ${ldcnt} ];
        then
            m=0;
        fi
    done
else
    for l in $(eval echo "{1..${ldcnt}}")
    do
        ((m++));
        if [ ${pth} -gt 0 ];
        then
            echo 1 > job.parallel.th${m};
        else
            echo 0 > job.parallel.th${m};
        fi
        ((pth--));
    done
fi
#loader launcher
for k in $(ls -tr job.queue.th*)
do
    thn=$(echo $k|cut -d '.' -f 3);
    export thn;
    export -f loader;
    { nohup bash -c loader ${thn} & } >/dev/null 2>&1;
done

Throughput Chart for Multiple Loader (aka - the above script):

# of jobs/sec is shown below...


Thank you for your visit.

We will meet in next blog.

Monday, March 1, 2021

Install & Setup Hadoop in Standalone Mode

Install & Setup Hadoop in Standalone Mode

Environment:
Os: Centos 7.9
Kernel: 3.10.0-1160.6.1.el7.x86_64
Java version:
openjdk version "1.8.0_282"
OpenJDK Runtime Environment (build 1.8.0_282-b08)
OpenJDK 64-Bit Server VM (build 25.282-b08, mixed mode)

1) Setup hadoop user in centos machine(follow blog link below)

https://oracledbaplanner.blogspot.com/2021/02/adding-linux-usergroup-and-modifying.html

2) Setup mountpoint for Apache hadoop install

[root@localhost ~]# mkdir /opt/hadoop

[root@localhost ~]# chown hadoop:bigdata /opt/hadoop

[root@localhost ~]# ls -altr /opt/hadoop
total 0
drwxr-xr-x. 4 root   root    53 Mar  1 02:14 ..
drwxr-xr-x. 2 hadoop bigdata  6 Mar  1 02:14 .
[root@localhost ~]#

3) Download the hadoop binary from url https://downloads.apache.org/hadoop/common/
Specifically like below..


wget https://downloads.apache.org/hadoop/common/hadoop-3.3.0/hadoop-3.3.0.tar.gz

4) Once download is finished, gzip decompress and untar the binary

[hadoop@localhost hadoop]$ ls -altr
total 489016
-rw-r--r--. 1 hadoop bigdata 500749234 Jul 15  2020 hadoop-3.3.0.tar.gz
drwxr-xr-x. 4 root   root           53 Mar  1 02:14 ..
drwxr-xr-x. 2 hadoop bigdata        33 Mar  1 02:32 .
[hadoop@localhost hadoop]$ gzip -d hadoop-3.3.0.tar.gz

[hadoop@localhost hadoop]$ ls -altr
total 1034752
-rw-r--r--. 1 hadoop bigdata 1059584000 Jul 15  2020 hadoop-3.3.0.tar
drwxr-xr-x. 4 root   root            53 Mar  1 02:14 ..
drwxr-xr-x. 2 hadoop bigdata         30 Mar  1 23:13 .

[hadoop@localhost hadoop]$ pwd
/opt/hadoop

[hadoop@localhost hadoop]$ ls -altr
total 1034752
-rw-r--r--. 1 hadoop bigdata 1059584000 Jul 15  2020 hadoop-3.3.0.tar
drwxr-xr-x. 4 root   root            53 Mar  1 02:14 ..
drwxr-xr-x. 2 hadoop bigdata         30 Mar  1 23:13 .
[hadoop@localhost hadoop]$ tar -tvf hadoop-3.3.0.tar|head
drwxr-xr-x brahma/brahma     0 2020-07-06 15:50 hadoop-3.3.0/
-rw-rw-r-- brahma/brahma   175 2020-03-24 13:23 hadoop-3.3.0/README.txt
..

I evaluated the nohup.out to see if there are any errors reported during in untar operation.So the file is nearly 1GB in size. After untar the total usage of the directory is 2GB in size.

[hadoop@localhost hadoop]$ ls -altr
total 1038160
drwxr-xr-x. 10 hadoop bigdata        215 Jul  6  2020 hadoop-3.3.0
-rw-r--r--.  1 hadoop bigdata 1059584000 Jul 15  2020 hadoop-3.3.0.tar
drwxr-xr-x.  4 root   root            53 Mar  1 02:14 ..
drwxr-xr-x.  3 hadoop bigdata         67 Mar  1 23:13 .
-rw-------.  1 hadoop bigdata    3486147 Mar  1 23:14 nohup.out

[hadoop@localhost hadoop]$ du -sh .
2.0G    .

[hadoop@localhost hadoop]$ du -sk .
2092064 .
[hadoop@localhost hadoop]$

5) Detect and set the java home. Run the below command on the centos machine, look for java.home and use that value to set JAVA_HOME in hadoop's .bash_profile file.

java -XshowSettings:properties -version

JAVA_HOME=/usr/lib/jvm/java-1.8.0-openjdk-1.8.0.282.b08-1.el7_9.x86_64/jre
export JAVA_HOME

6) Now launch a new session of hadoop user and follow the below steps [https://hadoop.apache.org/docs/current/hadoop-project-dist/hadoop-common/SingleCluster.html]

    a) Goto the untarred directory of the hadoop-3.3.0

[hadoop@localhost hadoop-3.3.0]$ ls -altr
total 84
-rw-r--r--.  1 hadoop bigdata   175 Mar 24  2020 README.txt
-rw-r--r--.  1 hadoop bigdata  1541 Mar 24  2020 NOTICE.txt
-rw-r--r--.  1 hadoop bigdata 27570 Mar 24  2020 NOTICE-binary
-rw-r--r--.  1 hadoop bigdata 15697 Mar 24  2020 LICENSE.txt
-rw-r--r--.  1 hadoop bigdata 22976 Jul  4  2020 LICENSE-binary
drwxr-xr-x.  3 hadoop bigdata  4096 Jul  6  2020 sbin
drwxr-xr-x.  3 hadoop bigdata    20 Jul  6  2020 etc
drwxr-xr-x.  2 hadoop bigdata  4096 Jul  6  2020 licenses-binary
drwxr-xr-x.  3 hadoop bigdata    20 Jul  6  2020 lib
drwxr-xr-x. 10 hadoop bigdata   215 Jul  6  2020 .
drwxr-xr-x.  2 hadoop bigdata   203 Jul  6  2020 bin
drwxr-xr-x.  2 hadoop bigdata   106 Jul  6  2020 include
drwxr-xr-x.  4 hadoop bigdata   288 Jul  6  2020 libexec
drwxr-xr-x.  4 hadoop bigdata    31 Jul  6  2020 share
drwxr-xr-x.  3 hadoop bigdata    67 Mar  1 23:13 ..
[hadoop@localhost hadoop-3.3.0]$

[hadoop@localhost hadoop-3.3.0]$ pwd
/opt/hadoop/hadoop-3.3.0
[hadoop@localhost hadoop-3.3.0]$

    b) Create input directory and copy *.xml files from etc/hadoop directory

[hadoop@localhost hadoop-3.3.0]$ mkdir input

[hadoop@localhost hadoop-3.3.0]$ ls -ld input
drwxr-xr-x. 2 hadoop bigdata 6 Mar  2 01:13 input
[hadoop@localhost hadoop-3.3.0]$ cp etc/hadoop/*.xml input/
[hadoop@localhost hadoop-3.3.0]$

    c) Launch the below command to let the example copy the unpacked conf directory to use as input and then finds and displays every match of the given regular expression. Output is written to the given output directory.

bin/hadoop jar share/hadoop/mapreduce/hadoop-mapreduce-examples-3.3.0.jar grep input output 'dfs[a-z.]+'

Output: 

2021-03-02 01:24:00,805 INFO impl.MetricsConfig: Loaded properties from hadoop-metrics2.properties
2021-03-02 01:24:00,932 INFO impl.MetricsSystemImpl: Scheduled Metric snapshot period at 10 second(s).
2021-03-02 01:24:00,932 INFO impl.MetricsSystemImpl: JobTracker metrics system started
2021-03-02 01:24:01,129 INFO input.FileInputFormat: Total input files to process : 10
2021-03-02 01:24:01,172 INFO mapreduce.JobSubmitter: number of splits:10
2021-03-02 01:24:01,460 INFO mapreduce.JobSubmitter: Submitting tokens for job: job_local440722701_0001
2021-03-02 01:24:01,460 INFO mapreduce.JobSubmitter: Executing with tokens: []
2021-03-02 01:24:01,680 INFO mapreduce.Job: The url to track the job: http://localhost:8080/
2021-03-02 01:24:01,680 INFO mapreduce.Job: Running job: job_local440722701_0001
2021-03-02 01:24:01,686 INFO mapred.LocalJobRunner: OutputCommitter set in config null
...
2021-03-02 01:24:04,925 INFO mapreduce.Job:  map 100% reduce 100%
2021-03-02 01:24:04,926 INFO mapreduce.Job: Job job_local2096128567_0002 completed successfully
2021-03-02 01:24:04,931 INFO mapreduce.Job: Counters: 30
        File System Counters
                FILE: Number of bytes read=1203532
                FILE: Number of bytes written=3576646
                FILE: Number of read operations=0
                FILE: Number of large read operations=0
                FILE: Number of write operations=0
        Map-Reduce Framework
                Map input records=1
                Map output records=1
                Map output bytes=17
                Map output materialized bytes=25
                Input split bytes=127
                Combine input records=0
                Combine output records=0
                Reduce input groups=1
                Reduce shuffle bytes=25
                Reduce input records=1
                Reduce output records=1
                Spilled Records=2
                Shuffled Maps =1
                Failed Shuffles=0
                Merged Map outputs=1
                GC time elapsed (ms)=41
                Total committed heap usage (bytes)=273997824
        Shuffle Errors
                BAD_ID=0
                CONNECTION=0
                IO_ERROR=0
                WRONG_LENGTH=0
                WRONG_MAP=0
                WRONG_REDUCE=0
        File Input Format Counters
                Bytes Read=123
        File Output Format Counters
                Bytes Written=23
[hadoop@localhost hadoop-3.3.0]$

    d) Verify the output

[hadoop@localhost hadoop-3.3.0]$ cat output/*
1       dfsadmin
[hadoop@localhost hadoop-3.3.0]$

[hadoop@localhost hadoop-3.3.0]$ ls -altr output/*
-rw-r--r--. 1 hadoop bigdata 11 Mar  2 01:24 output/part-r-00000
-rw-r--r--. 1 hadoop bigdata  0 Mar  2 01:24 output/_SUCCESS
[hadoop@localhost hadoop-3.3.0]$ cat output/part-r-00000
1       dfsadmin
[hadoop@localhost hadoop-3.3.0]$

# We are done with Standalone mode of operation. We will see Pseudo-Distributed Operation in seperate blog.